This is the last part of exploratory work on wykop.pl started here and here. We focus on finer activity of both single voters and voter groups. Full data can be found here.
Voting data
We scraped a relatively rich information on voting: voting time, voter’s username, and the reason for voting. This enables a detailed analysis of the voters. We divide this study into two parts, where we focus on single voters or groups of voters.
Single voters
We gathered information on ~100k voters. To find the most important actors in this sphere, we simply plot all voters on the activity plane with the total number of upvotes and downvotes on the axes. Besides the bulk of not-very-active voters, the most active actors are mostly specialized as either upvoters or downvoters with only several users showing high activity in both areas:
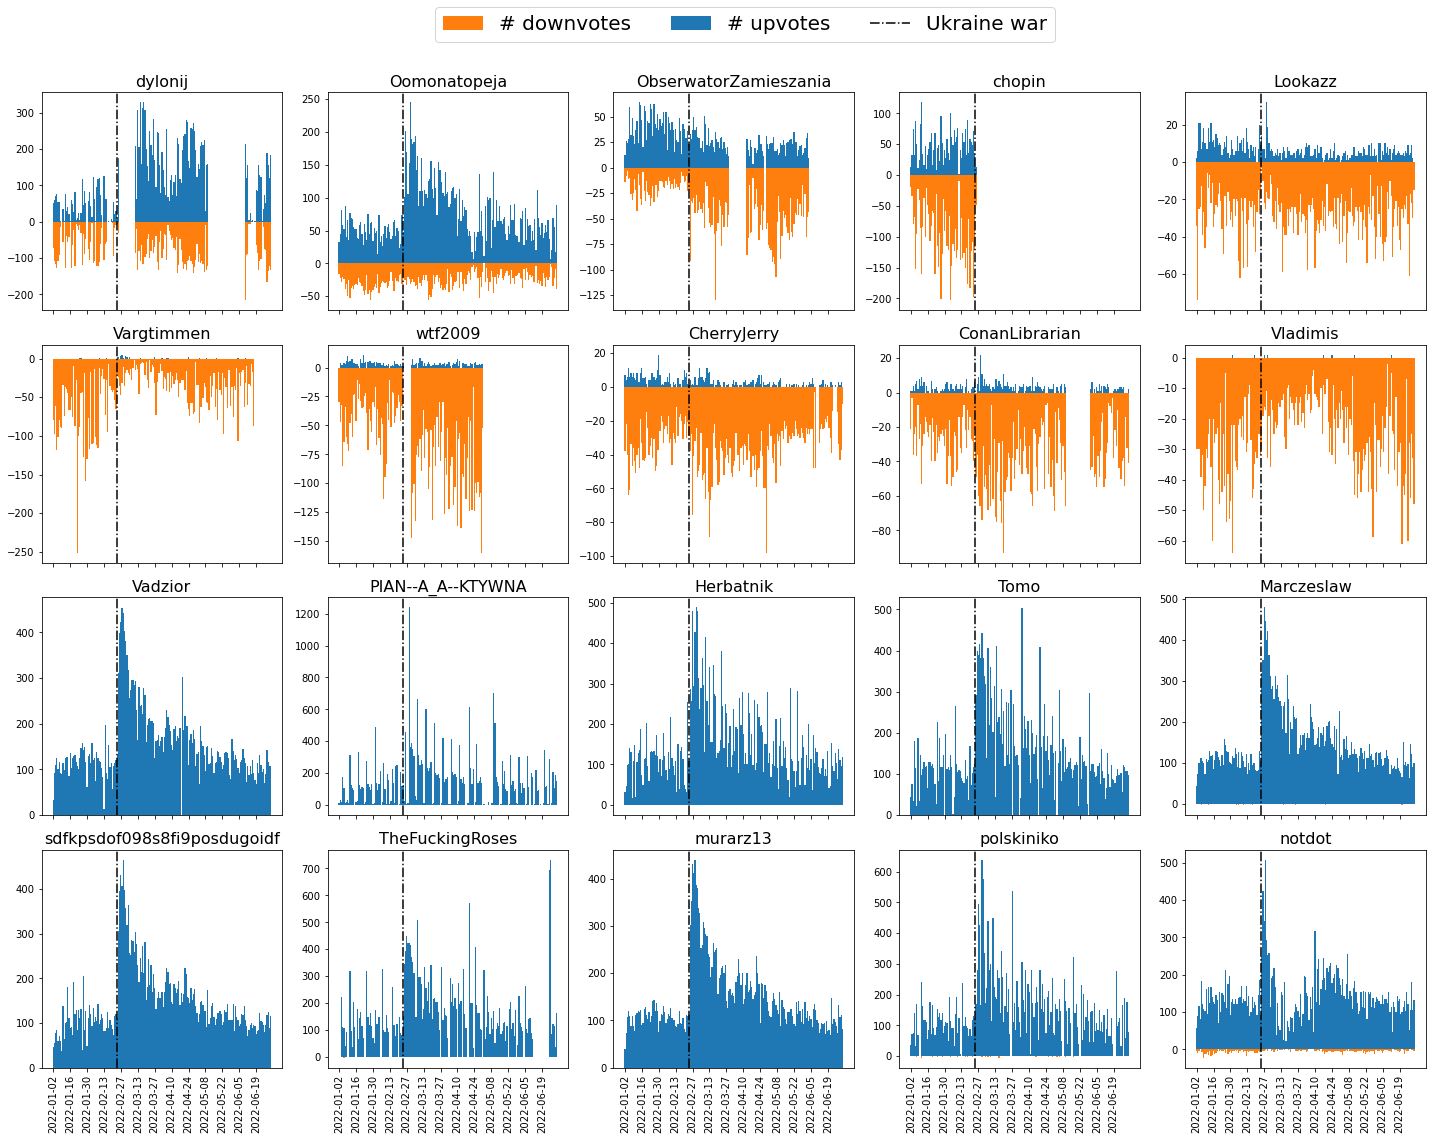
To gain additional insight, below we show time-resolved voting activity of the twenty most active users (first two rows with highest number of downvotes and the last two rows with highest number of upvotes). Blue and orange colors denote the upvotes and downvotes, respectively. Again, we observe a characteristic timestamp at the onset of the Ukraine war with a subsequent surge of activity. Interestingly, this sudden war-related change is more visible in the upvoting activity. All upvoting users tend to have similarly looking voting curves, while the downvoting users are less homogeneous. In particular, users dylonij, ObserwatorZamieszania, chopin, wtf2009 and ConanLibrarian admit a particularly sudden changes of behavior, from full activity to complete silence. This observation in conjunction with a relatively large number of daily interactions (as an example, on average dylonij votes 140 times/day) points towards a possible bot presence. Curiously, some of these voters like chopin and wtf2009 went silent at the onset of war.
Voter groups
Next, we consider informal groups of voters. To this end, we formulate voter-voter interaction matrices encoding three types of behavior between users x and y:
- upvoting cooperation (x and y both upvote a link),
- downvoting cooperation (x and y both downvote a link),
- antagonistic relationship ( upvotes while y downvotes a link or vice versa).
Each entry in the interaction matrix gives the total number of the respective relationships between a pair of voters. Because the resulting matrices are quite large (~100k x ~100k), we apply a cutoff to consider only the 4000 most active voters. For comparison, we form two simple null models:
-
null model A: fix link voting, permute voter choices. Each link retains the same total amount of up- and downvotes, but they come from different voters. As a result of the shuffling, the voting structure prevails while the voter hierarchy is destroyed, with users becoming homogeneous.
-
null model B: permute link voting, fix voter choices. In this case, each voter retains his own voting activity, while the voting structure for each link is scrambled. As a result, the voter activity hierarchy prevails, while their voting choices become random, resulting in homogeneous link voting.
Since we think of the actions of voters as primary, null models offer two edge cases for voter motivation. In model A, each voter is encouraged to pick intrinsically attractive links (as measured by the actual number of upvotes and downvotes) whereas in model B, the goal for each voter is to retain his own level of activity with links serving a secondary purpose towards that goal.
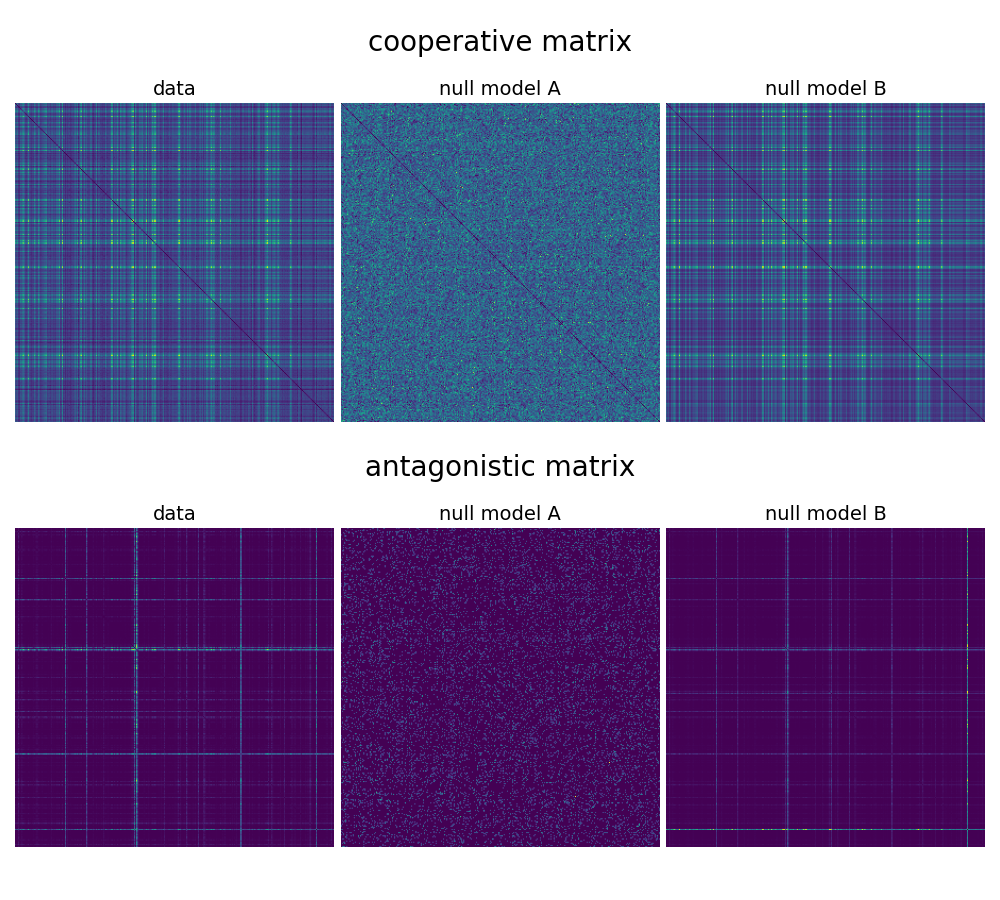
Below, we show how the cooperative (we merge both upvoting and downvoting cooperation) and antagonistic matrices look for the real data and both null models (we restrict to 300 most active voters for clarity):
In both the data and the null model, we perform a modularity-based clustering. In total, we perform six clustering procedures for cooperative and antagonistic matrices and for data and both null models. In each case, the result is a list of voter clusters which we plot below, ordered by their respective sizes:
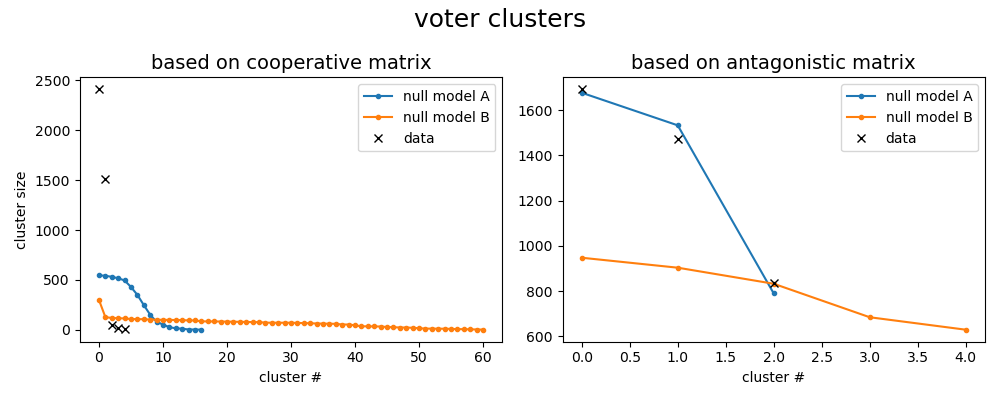
We look for data clusters that do not match the null models. We find that the two cooperative clusters are not explained by either null model. On the other hand, the cluster sizes found in the antagonistic matrix are well-explained by the null model A and are due to the link voting structure, i.e. the antagonisms show up since some of the findings are very popular and attract many voters with upvote-downvote matches. Still, all clusters contain useful information, since the models only address their sizes.
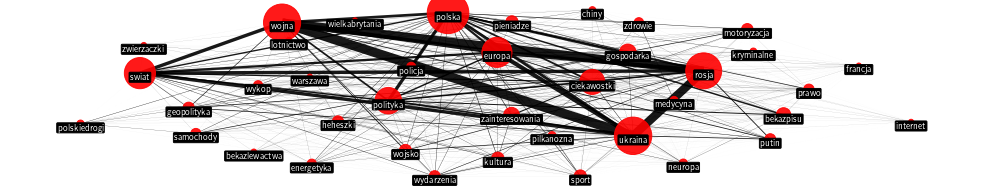
We turn to a study of clusters by establishing their tag composition. In each case, we take a subset of links voted on by any of the cluster members and identify their corresponding tags. Then, we inspect the cluster tag composition in comparison to the overall composition. The results show whether a cluster is more or less likely to participate in certain tags, shown below as either positive or negative deviations:
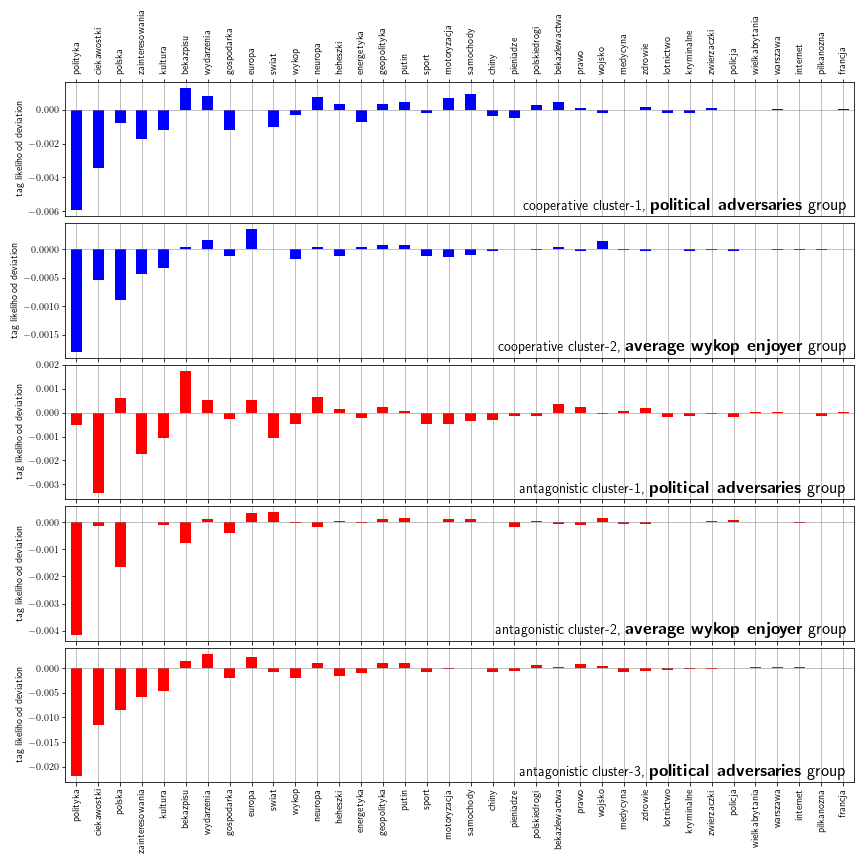
First, we did ignore three major war-related tags #wojna, #ukraina and #rosja due to their strong overrepresentation in all voter clusters. With that in mind, we discuss each cluster separately:
-
Cooperative cluster-1 shows an overrepresentation in tags #bekazpisu, #wydarzenia, #neuropa, #heheszki, #motoryzacja, #samochody and #bekazlewactwa with strong underrepresentation of tags #polityka, #ciekawostki, #zainteresowania, #gospodarka. It puts a group of cooperative users working in largely humorous political tags. At the same time, they seem to be not focused on the #polityka tag.
-
Cooperative cluster-2 is slightly overrepresented in tags #europa, #wojsko and #wydarzenia, underrepresented in tag #polska and in lighthearted tag #heheszki. This group is closer to the mean activity with smaller deviations. Interestingly, the #polityka tag is also strongly disfavored in this group.
-
Antagonist cluster-1 shows a large overrepresentation in contentious tags #bekazpisu, #neuropa, #bekazlewactwa and political tags #europa, #wydarzenia and #polska. It has some positive activity deviation in tags #zdrowie, #medycyna, #prawo and #geopolityka all of which can be traced to either the recent pandemics, livid discussion on the rule of law in Poland or the Ukraine war. Characteristically, it is the only cluster in which the tag #polityka is relatively favored. Most underrepresentation are found in the interest-related tags like #ciekawostki, #zainteresowania, #kultura, #sport, #motoryzacja and #samochody. In general, tag composition is similar to the cooperative cluster-1 while staying largely disinterested in nonpolitical tags.
-
Antagonistic cluster-2 is a cluster without major deviations with some interest-oriented tags like #zainteresowania and #kultura having larger contribution than the remaining clusters and some overrepresentation of tags #europa and #swiat. Characteristically, it has an underrepresentation of anti-government tag #bekazpisu.
-
Antagonistic cluster-3 is a highly focused cluster centered in tags #wydarzenia and #europa while remaining heavily underrepresented in tags #polityka, #ciekawostki, and #polska, among others.
Because we think of cooperative and antagonistic interactions as two sides of the same coin, we inspect overlaps between the discussed clusters.
We find that cooperative cluster-1, antagonistic clusters-1 and -3 show a higher-than-random voter overlap, together forming a group we call the political adversaries. Voters in this group show interest in tags related with politics and current affairs such as health care and geopolitics. They tend to be quite antagonistic with highest *overrepresentation in the anti-government tag *#bekazpisu, and the tag #neuropa ** focused on the contested activist group.
Similarly, there is a large overlap between voters in cooperative cluster-2 and antagonistic cluster-2 which form the second group of voters named the average wykop enjoyer. These gather average voters centered less on politics and more on interests.
Voting time
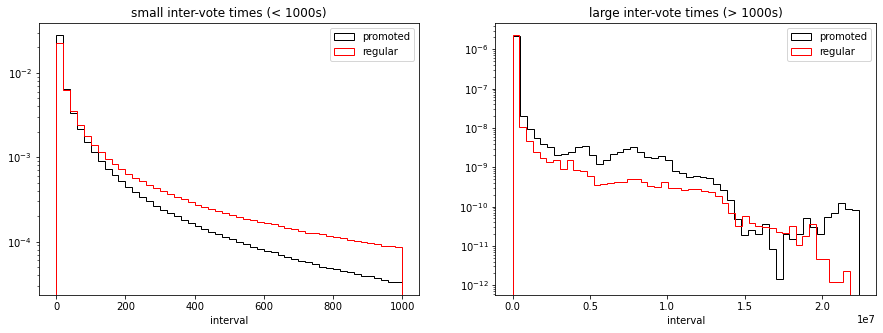
The last dimension we touch upon is the timing of votes. This information is of importance if there are groups organizing themselves to upvote or downvote a finding.
For short intervals dt < 1000 s, but upvote and downvote intervals admit a heavy-tailed distribution although with different exponents where the regular findings have fatter tails than the promoted ones, suggesting that most of the promoted findings have a more localized voting activity. For larger intervals dt > 1000 s, we do not find any significant patterns.
Conclusions
In this part, I inspect the fine details of user voting. Main conclusions in this part are:
- time-resolved activity of single users reveals suspect bot-like voting activity
- clustering analysis of voter-voter interactions reveals two cooperative and three antagonistic clusters of voters whose sizes are partially explained by the null models,
- these clusters form two groups of voters: a) the political adversaries centered around tags #bekazpisu, #wydarzenia, #neuropa, #heheszki, and #bekazlewactwa with a large antagonistic component, and b) the average wykop enjoyers comprising of moderate voters with activity focusing on interest-based and less politically charged tags like #zainteresowania or #ciekawostki.
- a heavy-tail distribution of intervals between times of both downvotes and upvotes.